The American economic miracle


The American economic miracle stands out as one of the most remarkable accomplishments in the United States’ 250-year history.
The idea of an “Economic Miracle” and the standards used to define it.
The term “economic miracle”—which entered global academic and public discourse after World War II—traditionally refers to a country’s economic success in achieving and sustaining high rates of economic growth over a significant period.
The most well-known examples of economic miracles are the cases demonstrated in the post-war decades by Germany, Italy, Japan, South Korea, Taiwan, Hong Kong, Singapore, China, and Ireland.
The primary criteria for identifying an economic miracle are:
- high rates of national economic growth (exceeding the global average);
- the sustainability of these high growth rates—that is, maintaining them for a specific period, lasting at least one decade.
Achieving and sustaining economic growth rates above the global average naturally increases the national economy’s share of the global economy. Thus, a change (specifically, an increase) in the national economy’s share of global GDP can also serve as an aggregate indicator of an economic miracle.
The American Economic Miracle: Quantitative Parameters
The first criterion of an economic miracle is an economic growth rate that exceeds the global average.
Over the 250-year period from 1775 to 2025, U.S. GDP increased 3,515-fold. No other state in existence at the end of the 18th century—nor any other state with a population exceeding 30 million in 2025—has achieved such a result.
The growth index of the American economy over this 250-year period exceeded the growth index of the entire global economy by a factor of 20.7.
| GDP growth indices in selected countries worldwide, 1775–2025 | ||
| Country | Growth, times | Exceeding the global economic growth index, times |
| United States | 3515 | 20.72 |
| Finland | 365 | 2.15 |
| Mexico | 335 | 1.98 |
| Peru | 288 | 1.70 |
| South Africa | 268 | 1.58 |
| Sweden | 165 | 0.97 |
| Germany | 104 | 0.61 |
| United Kingdom | 100 | 0.59 |
| Italy | 95 | 0.56 |
| France | 61 | 0.36 |
| World total | 170 | 1.00 |
| Sources: Maddison Project Database, 2023, Colonial Dates Dataset, 2019, IMF Database, World Bank Database | ||
A second criterion for an economic miracle is maintaining economic growth rates above the global average over an extended period. The European and East Asian economic “tigers” sustained above-average growth rates for two, three, or four decades—and China for nearly five.
In contrast, the United States demonstrated above-average economic growth rates for an unprecedented duration: 155 years, from 1790 to 1945.
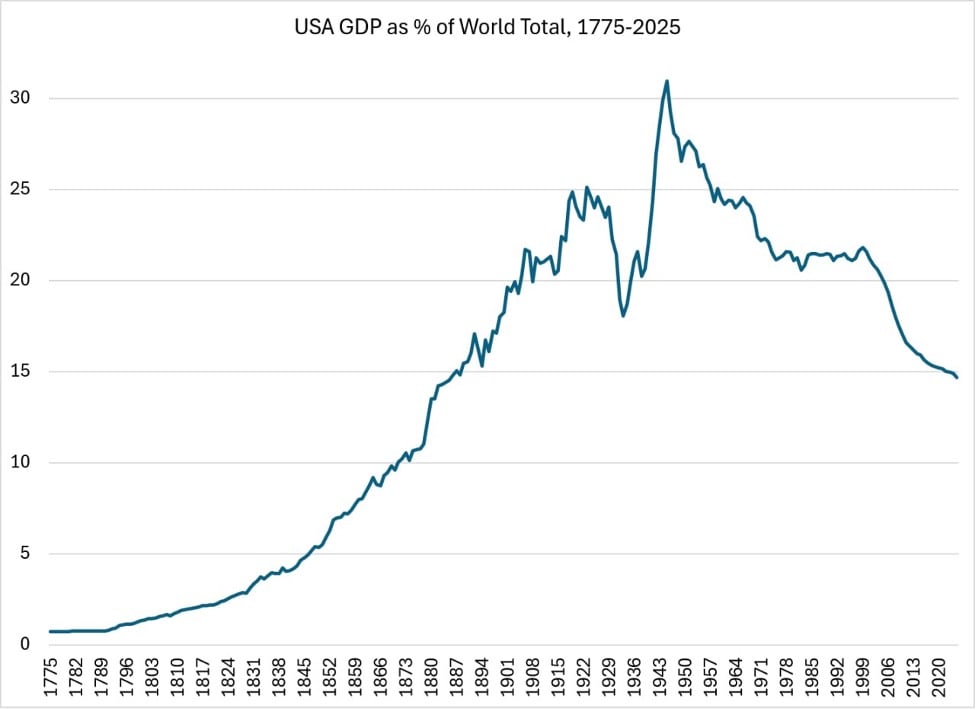
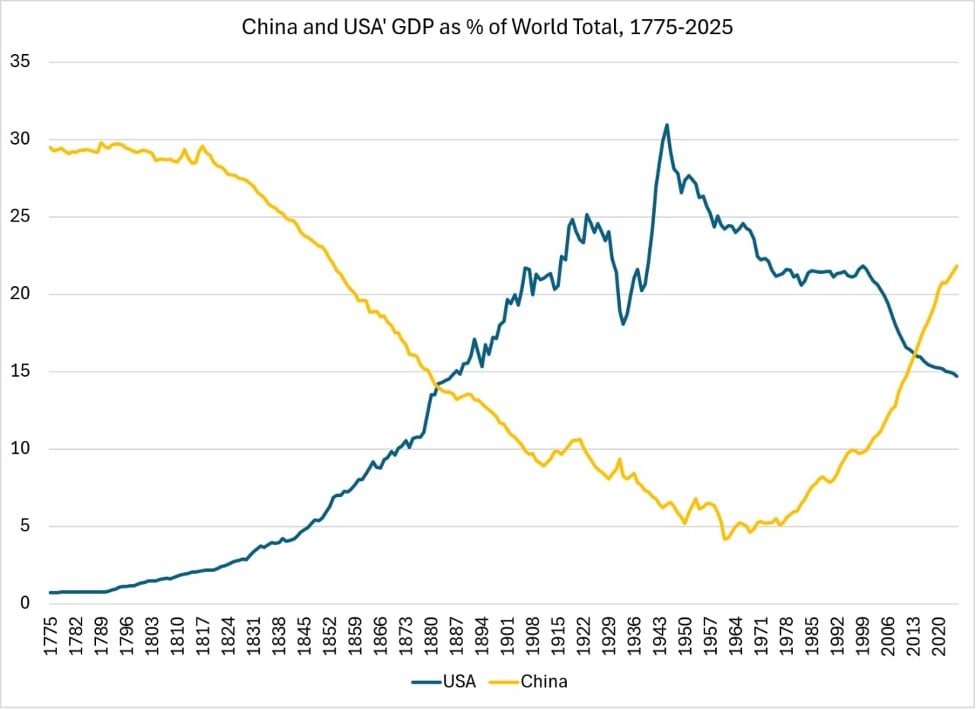
A comprehensive criterion for an economic miracle is an increase in the national economy’s share of global GDP. Between 1775 and 1945, the U.S. share of the global economy rose from 0.71% to 30.94%—an extraordinary increase of 30.2 percentage points of global GDP. No other country in the world has managed to increase its share of the global economy to such an extent over a similar period.
Components of U.S. Economic Success
In strictly mathematical terms, the volume of GDP produced is the product of the employed population and that population’s labor productivity. Another way to express GDP volume is as the product of the total population (which correlates closely with the employed population) and GDP per capita (which correlates closely with GDP produced per employed person—i.e., labor productivity). In other words, the two most important factors determining the volume of GDP produced are population size and GDP per capita.
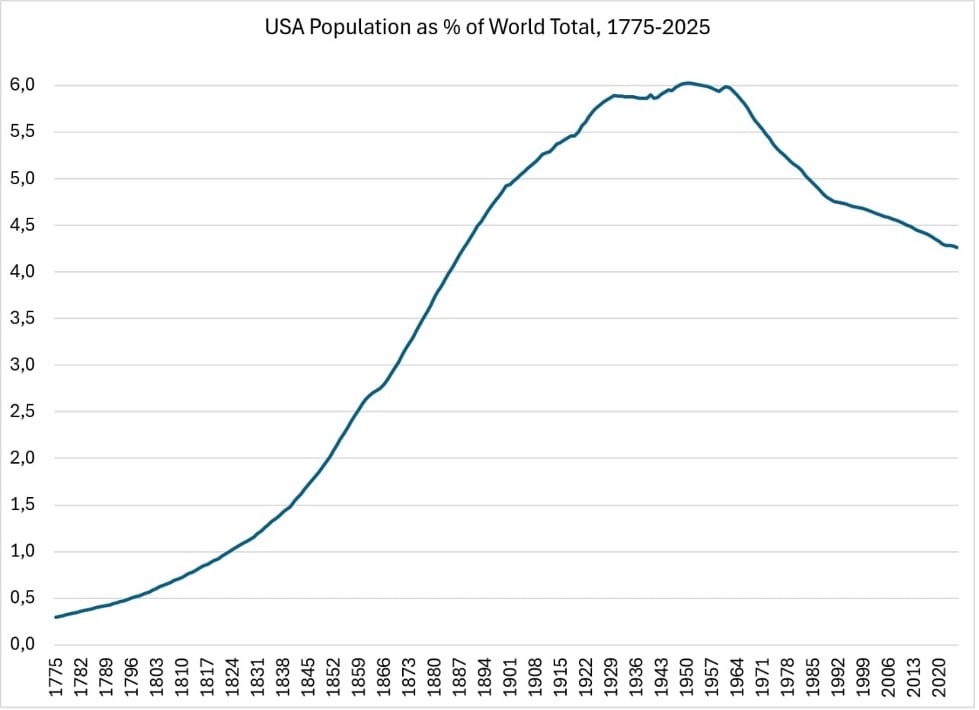
Over the course of 250 years, the U.S. population grew 138-fold. By this metric, the United States ranks near the top globally, although several dozen countries do surpass it in this regard. Nevertheless, the country’s significant population growth—particularly during its first 175 years (between 1776 and 1950) —contributed substantially to its rapid economic expansion and to the rising share of the U.S. in both the global population and the global economy.
It should also be noted that, since 1950, the U.S. share of the global population has steadily declined. Consequently, the net contribution of the demographic factor to changes in the U.S. share of the global economy has been negative over the past 75 years.
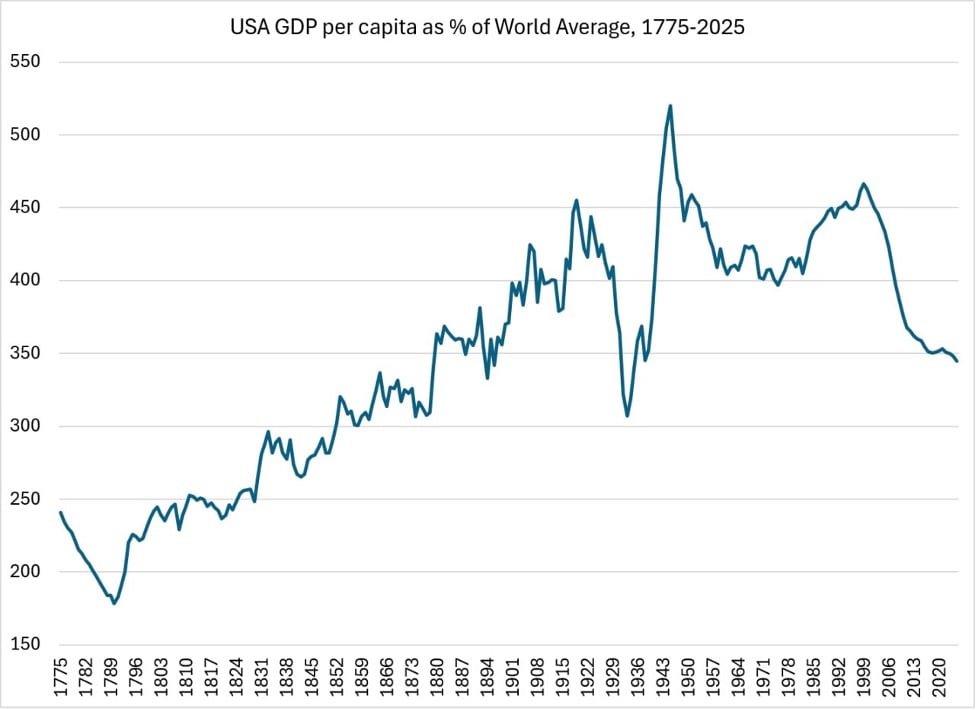
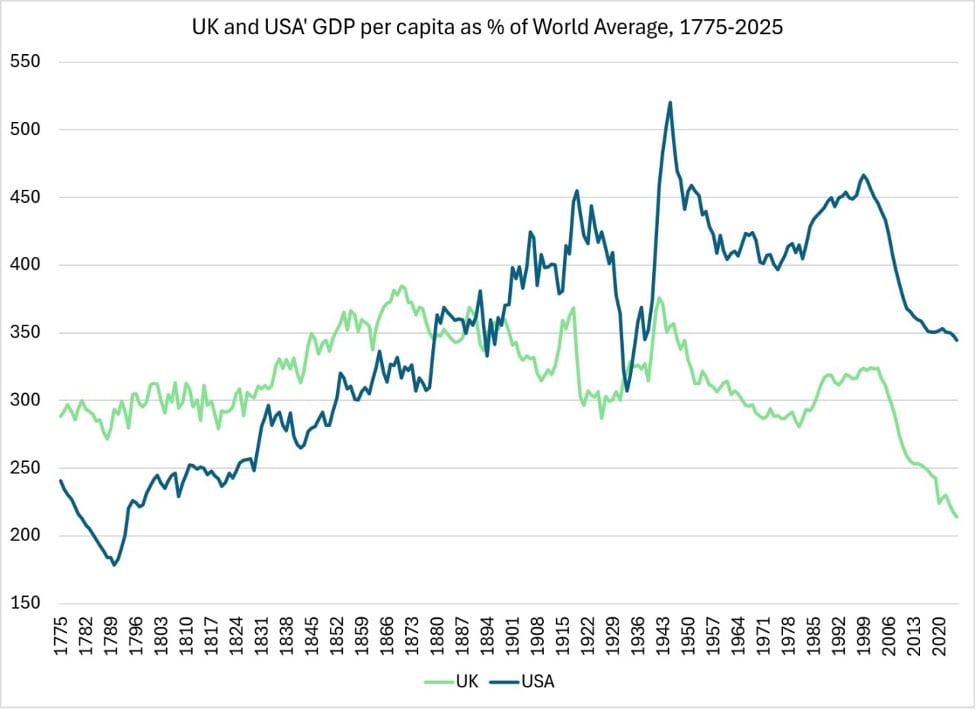
A far more significant contribution to the “American miracle” phenomenon came from steadily rising GDP per capita relative to the global average. Between 1775 and 1999, U.S. GDP per capita increased 18.4-fold (compared with a 9.5-fold increase globally). It was precisely this growth in per capita GDP—outpacing global averages and serving as a proxy for labor productivity—between 1790 and 1945 that played the decisive role in creating and sustaining the “American miracle” for 155 years.
The American economic miracle, global leadership, and the economic golden age
By applying the previously defined standard for an economic miracle—a more or less steady growth in the nation’s share of global GDP over a long period—we can pinpoint the timeframe that fits this criterion: that is, the 155-year span from 1790 to 1945.
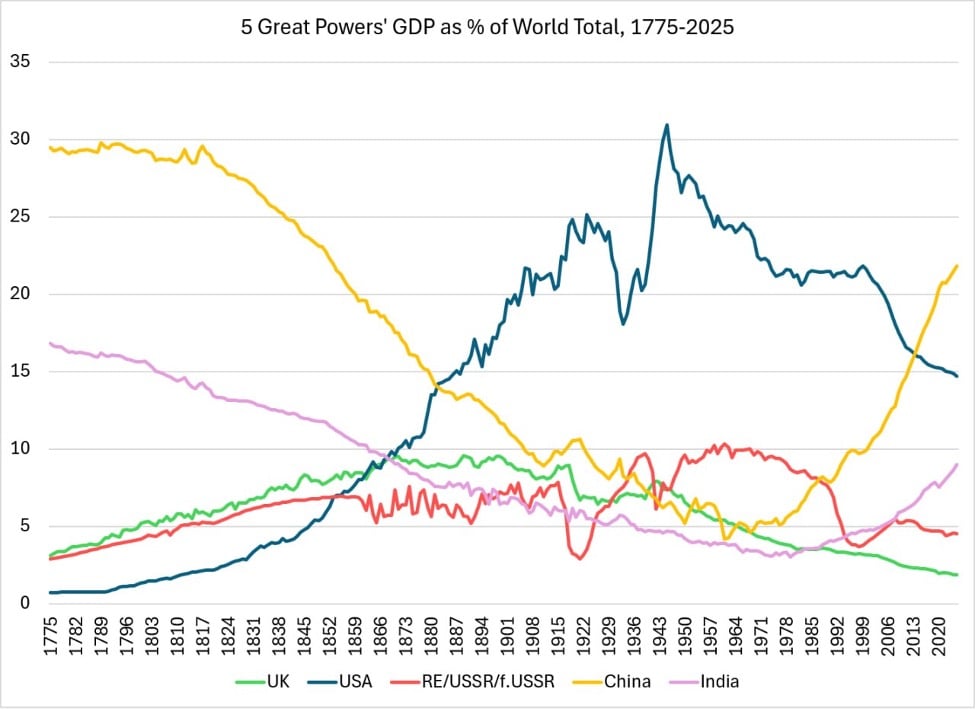
During the life of this economic miracle, the rapidly growing U.S. economy surpassed the size of the following economies:
- the Russian Empire in 1854,
- the British Empire in 1862,
- India in 1868, and
- China in 1882.
From 1882 onwards, the U.S. economy became the undisputed global leader in terms of GDP size.
The United States maintained this undisputed leadership until 2014, when China’s GDP (adjusted for purchasing power parity) surpassed that of the US for the first time. Thus, the period of American global economic leadership (in terms of absolute GDP) spanned 132 years, from 1882 to 2013.
Regarding the key driver of economic growth—GDP per capita—the U.S. definitively overtook the UK in 1899, following roughly two decades of figures that closely mirrored Britain’s.
Over the ensuing century—up to 1999—and despite various fluctuations (driven by both economic conditions and geopolitical upheavals), the U.S. managed not only to maintain a GDP per capita above the global average but even to widen the gap between itself and that average.
It is precisely this period—from 1899 to 1999—that can be termed the American “economic golden age.”
It should be noted that between 2000 and 2025, all indicators of U.S. economic dynamics (GDP growth rates, GDP per capita growth rates, and the national economy’s share of global GDP) have declined significantly and consistently, falling below global averages. The reasons for U.S. economic success during its first centuries of existence, as well as the causes of the significant slowdown in the American economy over the last quarter-century, warrant a separate article.
Conclusion
In conclusion, one can outline the chronology of key developments in 250-year U.S. economic history:
- 1790–1945 (155 years) – the American economic miracle;
- 1882–2013 (132 years) – American global economic leadership (by absolute GDP volume);
- 1899–1999 (101 years) – the American “economic golden age,” marked by US global leadership in terms of both GDP per capita and the steadily widening gap between this American figure and the global average.

- The American economic miracle - July 3, 2026
- Andrei Illarionov, Senior Analyst for Russian and European Affairs, joined The Drew Mariani Show - June 5, 2026
- Resistance: the only way to bring peace - April 17, 2026